
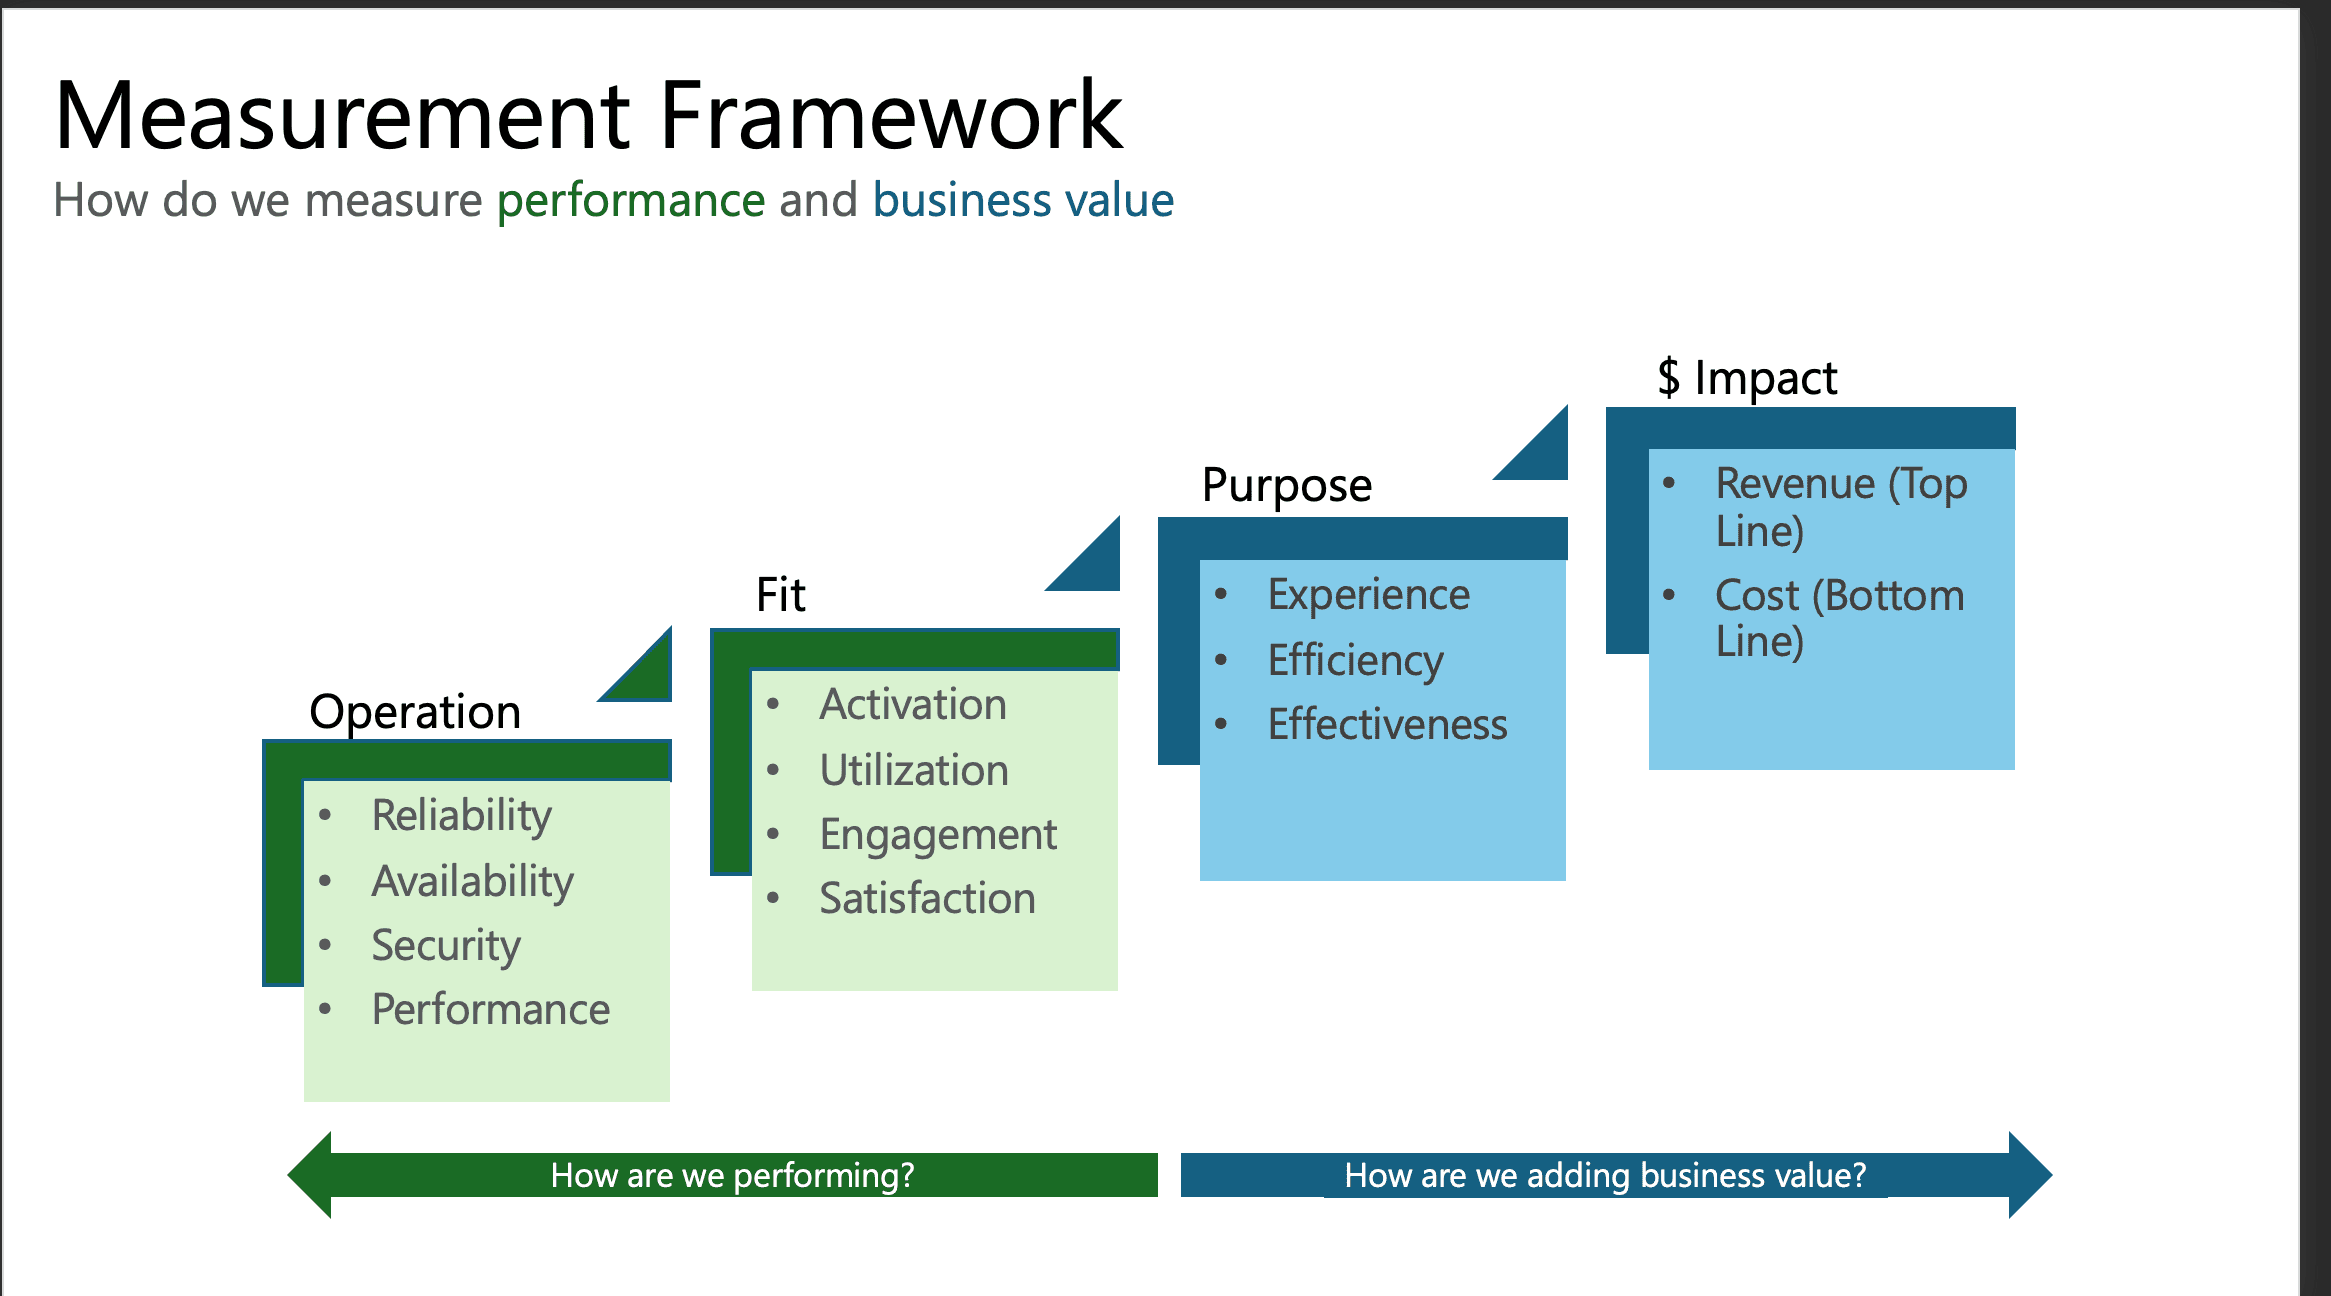
The four-pillar AI Measurement Framework
The Measurement Gap
Organizations are pouring resources into AI. New tools are being adopted, pilots are being launched, and budgets are growing. But ask most leadership teams a simple question — "Is our AI investment working?" — and you get silence, anecdotes, or vague references to productivity gains that nobody can quantify.
This is not a technology problem. It is a measurement problem. Without a structured framework for evaluating AI initiatives, organizations cannot distinguish between tools that are delivering real value and tools that are just generating activity. They cannot make informed decisions about what to scale, what to sunset, and where to invest next.
The AI Measurement Framework solves this by organizing measurement across four pillars that together answer two fundamental questions: "How are we performing?" and "How are we adding business value?"
Pillar 1: Operation — Is It Running Well?
Before you can measure whether an AI initiative is valuable, you need to know whether it is working. The Operation pillar covers the foundational technical health of your AI systems.
Reliability
How often does the AI system produce correct, consistent results? For an AI chatbot, this means the percentage of responses that are accurate and useful. For a classification model, it is precision and recall. Reliability is the bedrock — an unreliable AI system destroys trust regardless of its potential value.
Metrics to track: Error rates, hallucination rates, accuracy scores, consistency across repeated queries, model drift over time.
Availability
Is the system up and accessible when users need it? Downtime in an AI-powered workflow does not just inconvenience users — it breaks processes that may now depend on the AI to function. If your AI-powered intake system is down, governance submissions stop.
Metrics to track: Uptime percentage, mean time to recovery (MTTR), scheduled vs. unscheduled downtime, API response success rates.
Security
Is the system secure? AI introduces unique security considerations — data sent to model providers, prompt injection vulnerabilities, model outputs that might leak sensitive information. Security is not a one-time assessment but a continuous operational concern.
Metrics to track: Security incidents, data exposure events, access control violations, vulnerability remediation time, compliance audit results.
Performance
Is it fast enough? AI systems that are technically correct but painfully slow will not get used. Response latency, throughput capacity, and resource efficiency all matter — especially as usage scales.
Metrics to track: Response latency (p50, p95, p99), throughput (requests per second), token consumption, cost per inference, resource utilization.
Pillar 2: Fit — Are People Actually Using It?
An AI tool can be perfectly reliable, available, secure, and fast — and still fail completely if nobody uses it, or if users use it once and never come back. The Fit pillar measures whether the AI initiative has found product-market fit within your organization.
Activation
Of the people who have access, how many have actually started using the tool? Low activation signals a discoverability problem, an onboarding problem, or a relevance problem. If you rolled out an AI tool to 500 people and only 30 have tried it, something is wrong — and it is not the AI.
Metrics to track: Activation rate (users who completed first meaningful action / total users with access), time to first use, onboarding completion rate.
Utilization
How frequently and deeply are active users engaging? There is a critical difference between a tool that gets used once a week for a simple task and one that is deeply integrated into daily workflows. Utilization shows whether the tool has become part of how work gets done.
Metrics to track: Daily/weekly active users, sessions per user per week, features used per session, depth of usage (basic vs. advanced features).
Engagement
Are users coming back? Sustained engagement over time is the strongest signal that an AI tool is genuinely useful. A spike of curiosity-driven usage in the first week followed by a steep drop-off is a red flag — the tool is interesting but not valuable.
Metrics to track: Retention curves (Day 7, Day 30, Day 90), churn rate, returning user percentage, session duration trends.
Satisfaction
Do users think it is good? Usage data tells you what people do; satisfaction data tells you how they feel about it. An AI tool that people are forced to use by process requirements but actively dislike will generate resentment, workarounds, and eventually abandonment.
Metrics to track: User satisfaction scores (CSAT), Net Promoter Score (NPS), qualitative feedback themes, support ticket volume and sentiment.
Pillar 3: Purpose — Is It Making Work Better?
The first two pillars answer "How are we performing?" The Purpose pillar shifts to the business value side: "What is this AI actually doing for us?" An AI tool that runs flawlessly and gets used daily is still a failure if it does not improve the work.
Experience
Is the AI improving the experience for customers, employees, or other stakeholders? This could mean faster response times for customer inquiries, less tedious data entry for employees, or better search results for knowledge workers. Experience improvements are often the first tangible benefit of AI and the easiest to measure.
Metrics to track: Customer satisfaction improvement, employee experience scores, time-to-resolution, self-service completion rates, quality of AI-assisted outputs vs. manual outputs.
Efficiency
Is the AI helping people do the same work faster or with fewer resources? Efficiency gains are the workhorse of AI value — automating repetitive tasks, reducing manual data processing, accelerating document review. The key is measuring actual time saved, not theoretical time saved.
Metrics to track: Time savings per task, tasks completed per hour (before vs. after), manual steps eliminated, processing time reduction, FTE hours redirected to higher-value work.
Effectiveness
Is the AI helping people do better work — not just faster, but with higher quality outcomes? An AI that helps salespeople close deals faster is efficient. An AI that helps them identify and prioritize the right prospects is effective. Effectiveness is harder to measure than efficiency but often more valuable.
Metrics to track: Decision quality improvements, error rate reduction, output quality scores, outcomes per initiative (e.g., conversion rates, defect rates), strategic alignment of AI-assisted decisions.
Pillar 4: $ Impact — What Is the Financial Return?
Ultimately, every AI initiative needs to justify its cost. The Impact pillar translates the experience, efficiency, and effectiveness improvements into the language the C-suite cares about most: dollars.
Revenue (Top Line)
Is the AI helping grow revenue? This could be direct — an AI-powered recommendation engine that increases average order value — or indirect — an AI tool that accelerates product development cycles, getting new offerings to market faster. Not every AI initiative will have a clear revenue impact, and that is fine. But when it does, quantify it.
Metrics to track: Revenue attributed to AI-assisted processes, conversion rate improvements, new revenue streams enabled by AI, time-to-market acceleration, customer lifetime value changes.
Cost (Bottom Line)
Is the AI reducing costs? The efficiency gains from Pillar 3 translate directly into cost savings — fewer hours spent on manual processes, reduced error remediation costs, lower customer support volume. But cost impact also includes the cost of the AI itself: licensing, compute, implementation, and ongoing maintenance. A complete picture requires both sides.
Metrics to track: Total cost of ownership (TCO), cost savings from automation, cost avoidance (errors prevented, compliance violations avoided), ROI per initiative, payback period.
Putting the Framework Into Practice
The four pillars are not independent — they form a logical progression. Operation is the foundation: if the system is not running well, nothing else matters. Fit comes next: if people are not using it, there is no value to measure. Purpose validates that usage is translating into real improvements. And Impact quantifies those improvements in financial terms.
In practice, here is how to apply this framework across your AI portfolio:
1. Baseline Before You Launch
Before deploying any AI initiative, capture baseline metrics for the processes it will affect. How long does the task currently take? What is the current error rate? What is the current cost? Without baselines, you cannot measure improvement.
2. Start With Operation and Fit
In the first weeks after launch, focus measurement on the left side of the framework. Is the system stable? Are people adopting it? Fix operational issues and adoption blockers before worrying about business value — if the foundation is not solid, value measurement is premature.
3. Measure Purpose at 30-60 Days
Once the tool is operationally stable and achieving meaningful adoption, begin measuring Purpose metrics. Compare against your baselines. Are tasks getting done faster? Are outcomes improving? Is the experience better? This is where you start to see whether the AI is actually adding value.
4. Quantify Impact Quarterly
Financial impact takes time to materialize and measure accurately. On a quarterly cadence, translate Purpose metrics into dollar terms. Calculate the hours saved multiplied by loaded labor costs. Estimate revenue uplift from improved conversion rates. Compute the full cost of ownership. Present this to leadership as a portfolio view across all AI initiatives.
5. Use the Framework to Make Decisions
The real power of the framework is not just reporting — it is decision-making. An initiative with strong Operation and Fit scores but weak Purpose scores might need retraining or reconfiguration. An initiative with strong Purpose but poor Impact might be genuinely useful but too expensive to justify. An initiative with low Fit scores should be investigated for adoption barriers before any other investment.
Common Pitfalls
- Measuring only what is easy: Usage statistics are easy to pull. Business impact is hard. Many organizations stop at Pillar 2 (Fit) and declare success because adoption numbers look good — while never confirming that usage is translating into value.
- Measuring too early: Trying to calculate ROI in the first week of a pilot is meaningless. Give initiatives time to stabilize operationally and achieve adoption before demanding financial justification.
- Ignoring the cost side: An AI initiative that saves 100 hours per month sounds great — until you realize it costs more to run than those 100 hours were worth. Always measure value net of the total cost of the AI itself.
- One-size-fits-all metrics: A customer-facing AI chatbot and an internal document classifier serve different purposes and should be measured with different specific metrics. The four pillars stay the same, but the specific KPIs under each pillar should be tailored to the initiative.
From Activity to Accountability
The AI Measurement Framework transforms AI investment from a faith-based exercise into a data-driven discipline. By organizing measurement across Operation, Fit, Purpose, and Impact, you create a shared language for evaluating AI across the organization — from the technical teams managing systems to the executives approving budgets.
The enterprises that will win the AI era are not the ones that adopt the most tools. They are the ones that know which tools are working, which are not, and why. That starts with measurement.
